Setting Up Explorative UX Analytics
8 min read time
01 Apr 2022
Capturing what users won't tell you through quantitative data analysis and explorative UX analytics.

Data is an important cornerstone of UX, and yet it's one of the most overlooked aspects in many teams. It's not uncommon for organizations to use a handful of data-driven user-related KPIs to quantify whether their product contributions are constructive, but it's rare for some teams to utilize their user data beyond that - especially in the field of UX.
There are many tools on the market that offer product- or user analytics, but very often these tools are narrow in scope. They tend to target specific - often conversion- or acquisition-related - points in the user journey, rather than supporting UX professionals in explorative user behavioral analytics.
For this reason, it can be benificial to set up tooling and processes for preemptively collecting quantitive behavioral data in a more purpose-agnostic manner. Rather than limiting analytics to driving conversion, acquisition or purchases, it can be used for making more informed design decisions and improving the user experience in a more general sense.
Specific examples of how it can be helpful to gather quantitative user behavioral data in order to conduct explorative analysis are:
- Determining which features that are over- or underused.
- Determining where in a user flow that users are dropping off.
- Observing the path that users take to reach a specific goal.
- Gaining insights into how long users stay on any given view.
- Analyzing behavioral differences between platforms and devices.
- Tracking user behavioral metrics over time.
- A/B-testing new product features using user events for evaluation criterions.
- Auditing products and discovering bottlenecks in user journeys.
- Having immediate access to data points relevant for product discussions.
When it comes to looking at specifics of how to implement explorative user analytics, the most important features are the ability to send user behaviors to the intended analytics platform, and the ability to visualize those events in a meaningful way. Datadog and Google Analytics are two well-known tools that are capable of collecting and visualizing user behavioral data. For handheld devices, Google Analytics and Firebase work well. Even HubSpot can track behavioral events to some extent.
After having installed the tool of choice, the first step is to ensure that user event tracking is implemented correctly. Many of these tools already come with basic user fingerprinting, but more meaningful insights may only be viable through manually defining which user events to track. This is done by setting up custom-defined triggers in the views, that are sent to the analytics tool whenever a user interacts with them.
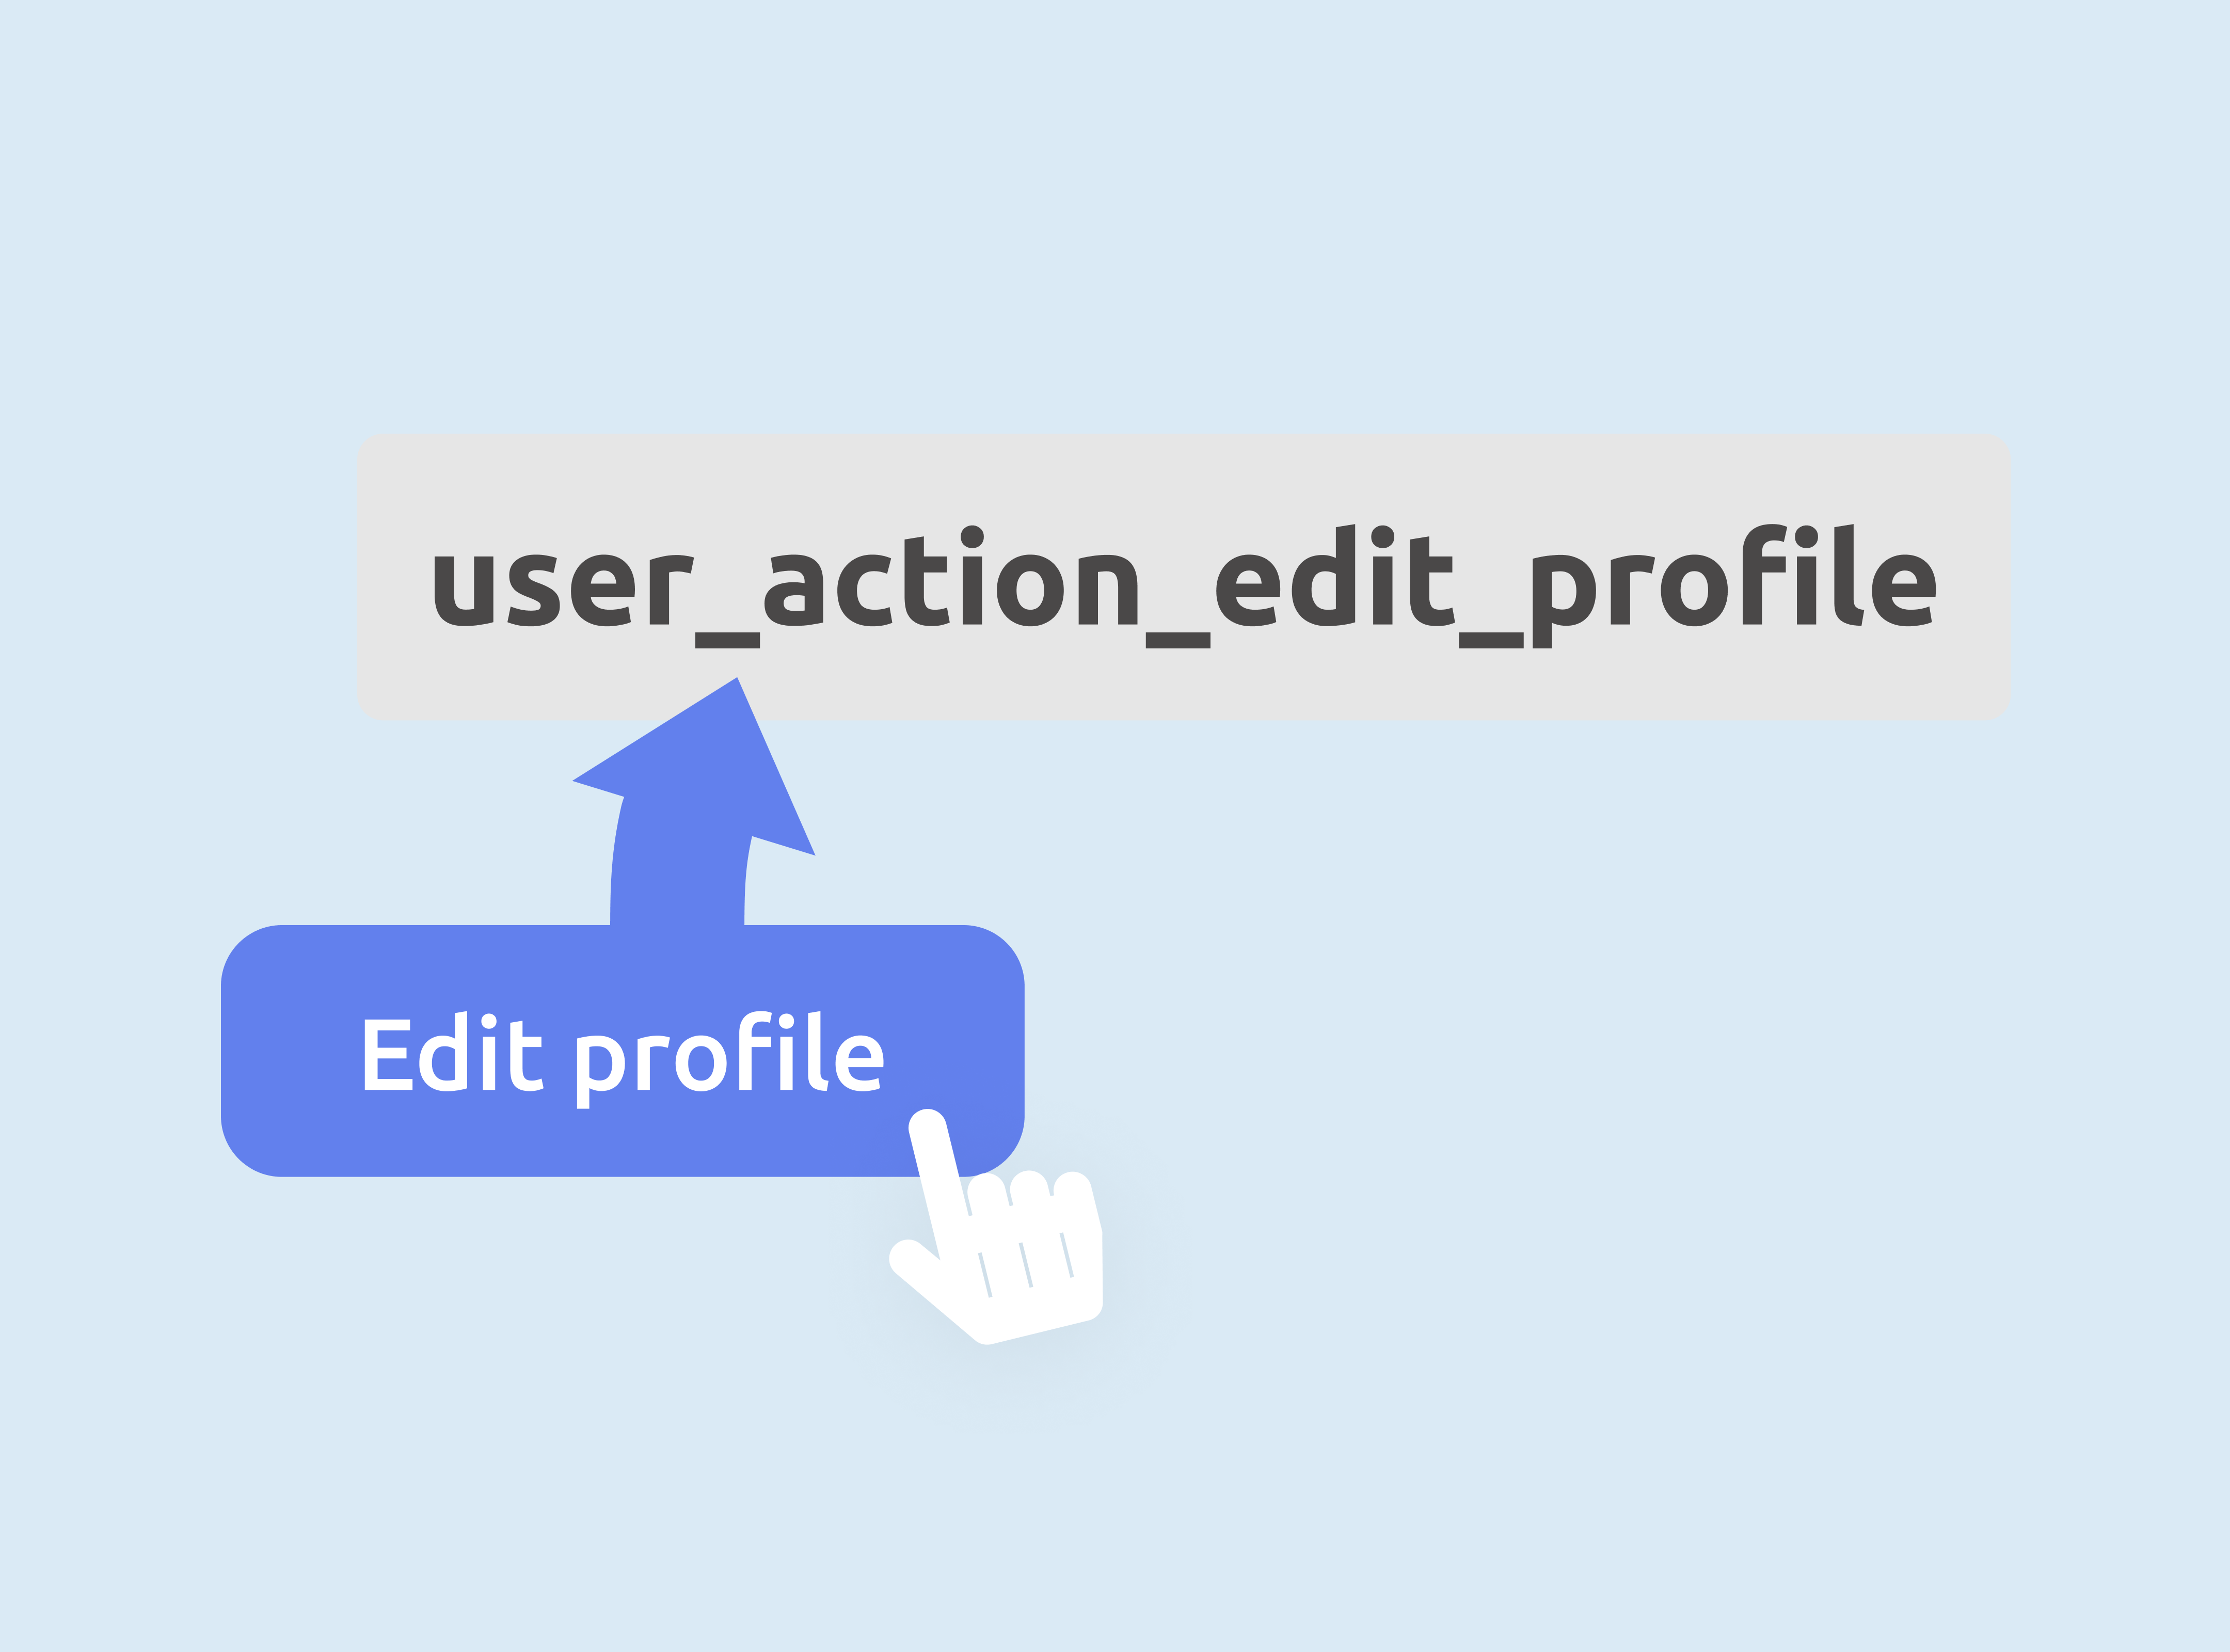
Examples of custom events that could be helpful to define might be triggers that determine which views that users visit, which types of actions that they're trying to take or what kind of error messages that they're receiving.
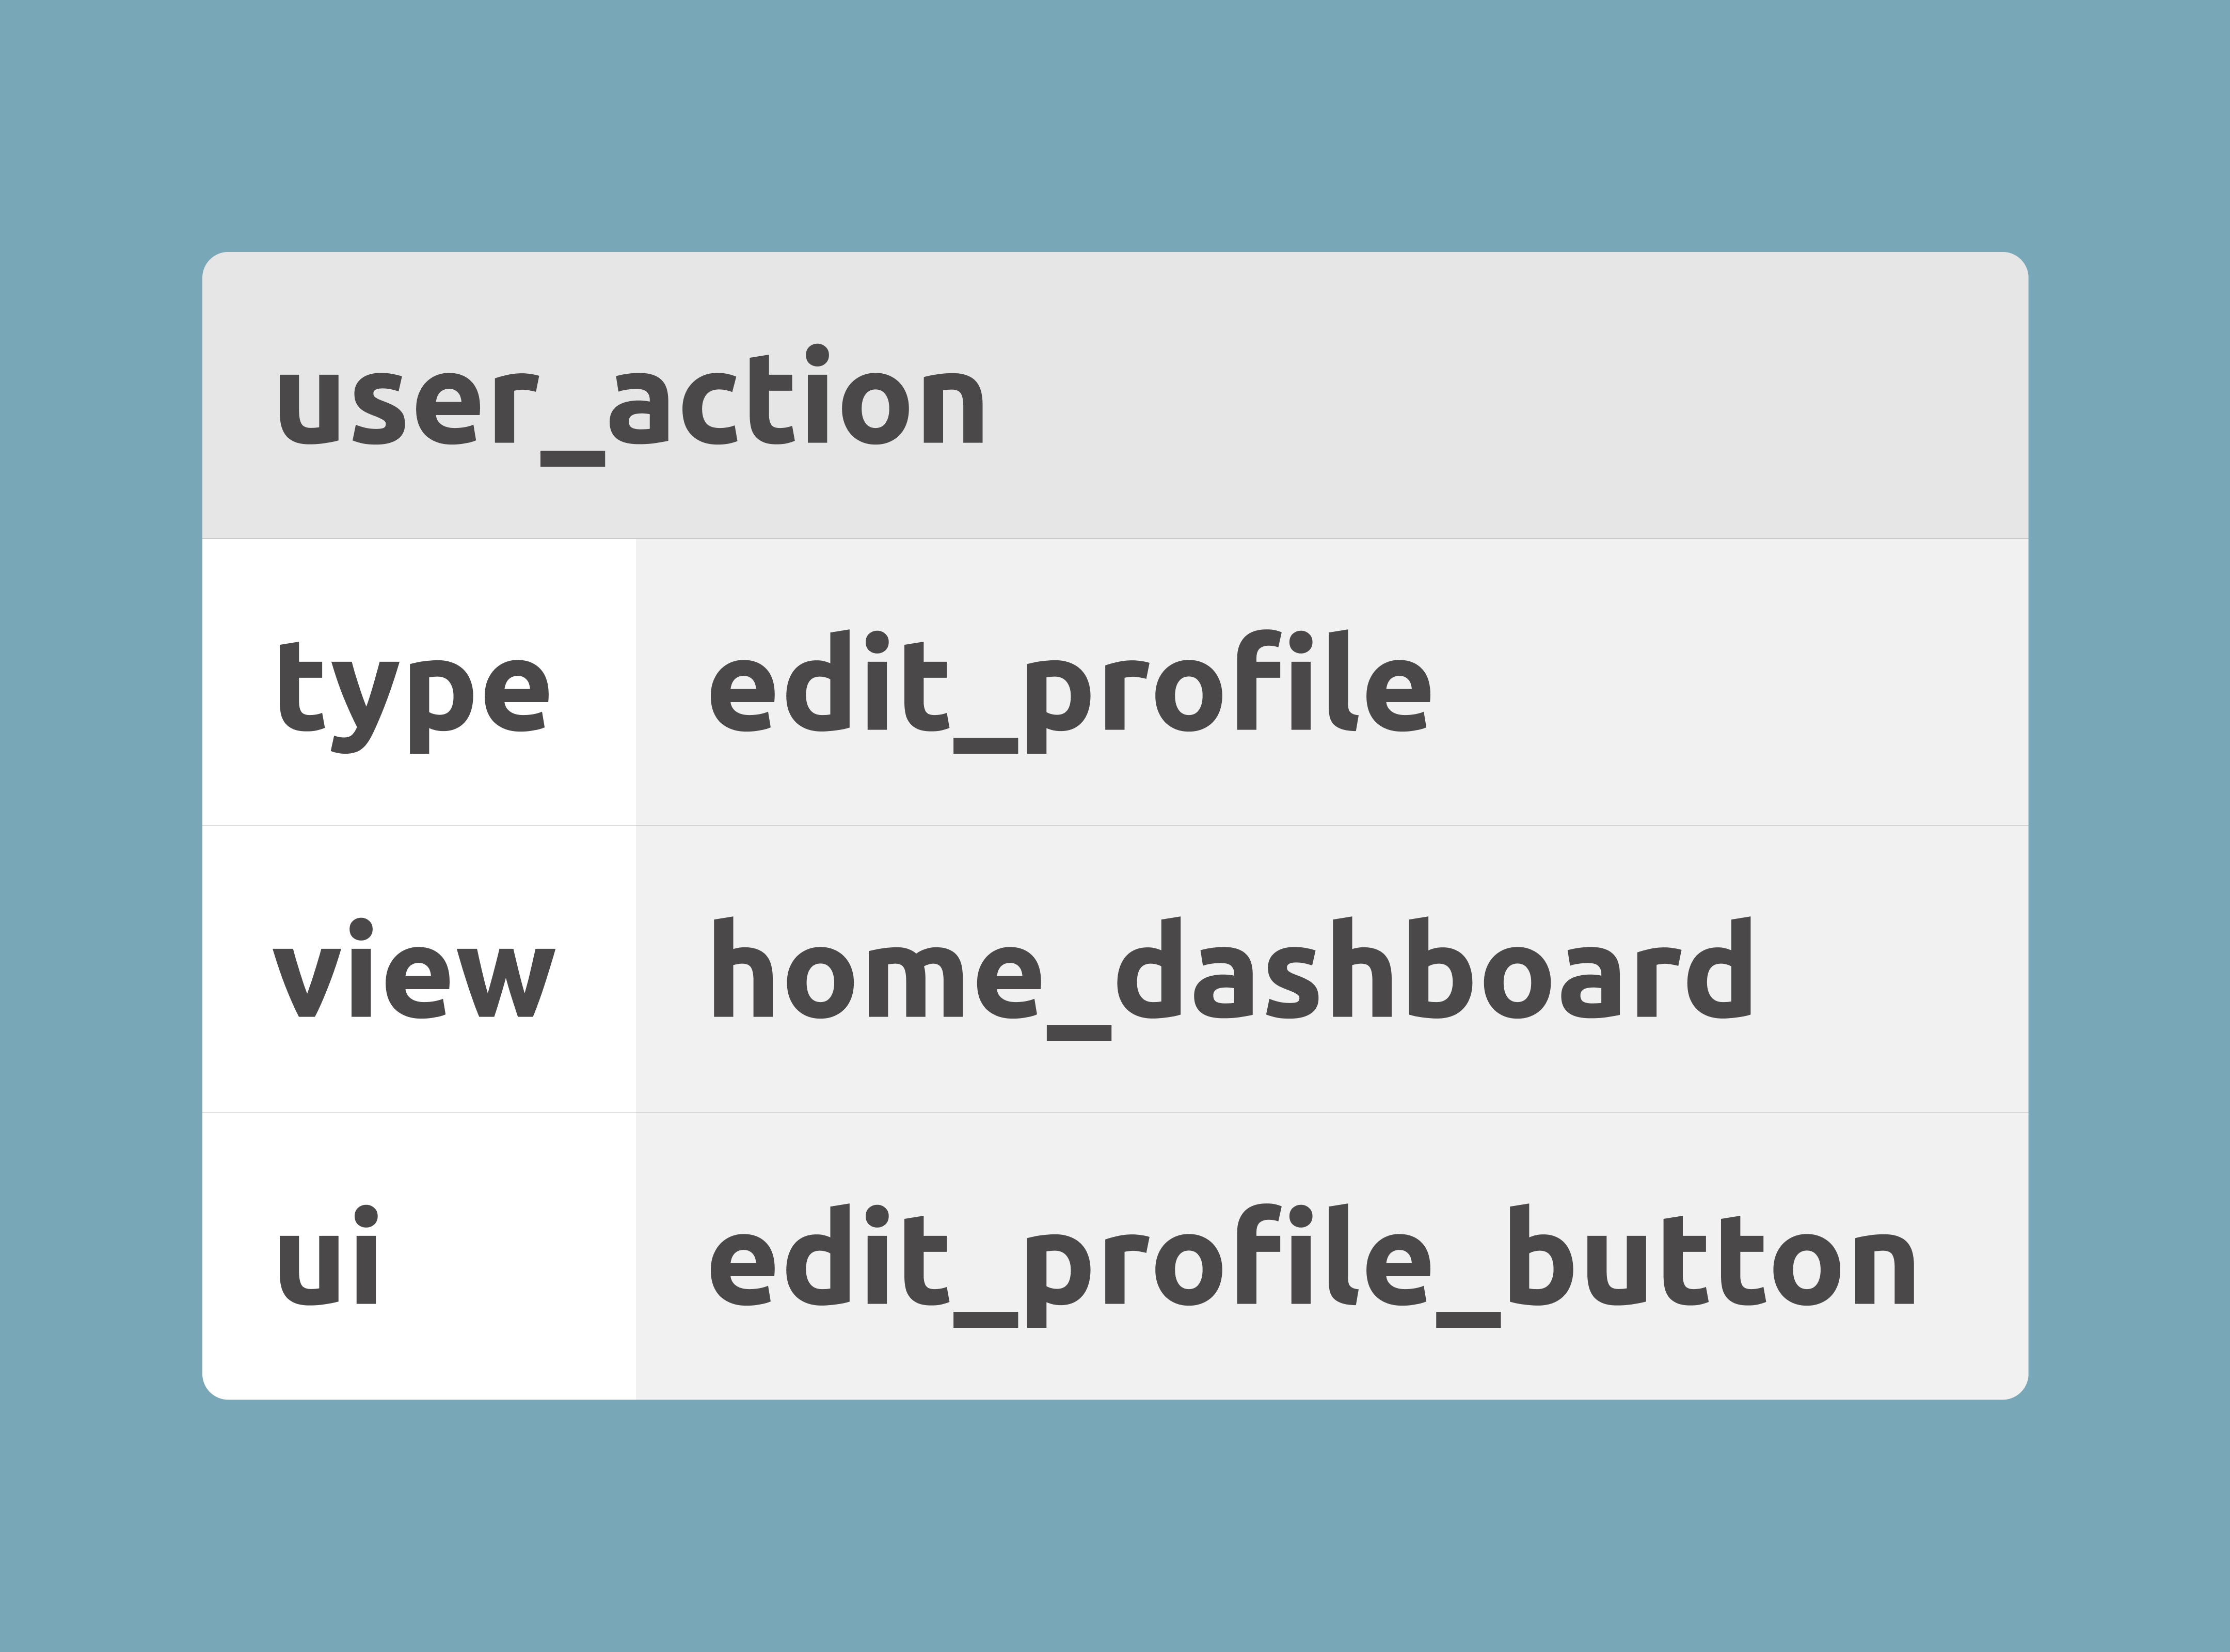
If the analytics tool of choice can handle parameters being sent along with the custom events, then additional data points can be included with with any of the user behaviors that are being tracked by the tool.
Additional user event parameters are important for being able to analyze information in more detail. By attaching more data to each user event, more informative filtering can be done across the users' entire journeys. For instance rather than merely being able to view statistical averages, one could also look at behavioral differences filtered by customer types or industries - provided that those data points have been defined as additional parameters.
Once the data has been defined, implemented and sent to the analytics tool, the next step is to set up the relevant views in the analytics tool. The way to do this differs between tools, but using Google Analytics as an example "Explorations" can be created in the "Explore" section - in order to help visualizse the event data.
Explorations can be set up as funnels, paths or free-form to name a few visualization alternatives. Funnels are a good way to start, because they allow for a simple and linear representation of custom user events.

In a Google Analytics Exploration Funnel, the steps in the funnel can be built using any of the defined custom user events that have been triggered by users and sent to the tool.
An example of a basic funnel might look as such:
- User Visits Login Page
- User Initiates Login Attempt
- User Successfully Logs In
- User Visits Logged-in Home Page
- User Logs Out
The above mentioned funnel would visualize all of the instances where a unique user has successfully logged in, and then logged back out again.
When a user flow has been visualized in the analytics tool, it can be analyzed on the basis of whatever facets that need to be studied. As an example, one could look at the abandonment rate, task success rate or time to completion of a specific user flow. One could also use visualized user flows to help answer product questions, such as "On average, how many users of type X are interacting with Y feature."

These are a few fundamental examples, but they can be extrapolated on in order to cover most relevant use cases where one might want to quantitatively shadow users. In addition, custom events sent to analytics tools can be connected to third party monitoring, dashboard- or business intelligence systems in order to continuously track user data- and user behavior over time. In fact, such integrations can even be used as the basis for UX KPIs.
Having user data at one's disposal is useful in most aspects of UX- and product work. Exploratory quantitative user behavioral analysis can often help empower research- and product discussions, and when integrated with UX workflows to the point where it becomes a frequent exercise for UX professionals the value of doing so usually becomes abundantly clear.
If the suggestions feel overwhelming, a recommendation would be to start simple:
- Decide on an analytics tool to use (e.g. Google Analytics).
- Define a user flow that you would like to track (e.g. logging in).
- Decide on a question that you would like to have answered (e.g. the log in success rate)
- Define the custom events that constitute the user flow (i.e. key user interactions wtihin the log in flow).
- Implement the code for sending the user interactions to the analytics tool (e.g. through JavaScript events).
- Visualize the user flow in the analytics tool by using the user events (e.g. a Google Analytics Exploration Funnel)
- Analyze the funnel to acquire the relevant information (i.e. looking at the funnel in order to answer questions that you might have that are related to user behavior)
The above steps can be repeated for every question that needs to be answered, or every user flow that needs to be analyzed.
One helpful suggestion could be to implement a weekly ritual for defining new questions, events and user flows. Making it a weekly habit to define- and analyze data is a good way to utilize it without making it too big of a commitment alongside other priorities.
If you think that behavioral user data might be at all interesting, this guide might serve as a useful starting point. Having quantitative data to support one's decisions is beneficial more often than not, and pairing quantitative data with qualitative user research can constitute a powerful combination for decision-making.
Share this story
Did you like this story?
I write these articles in order to try to provide inspiration, insights and perspectives for UX practictioners and non-UX practictioners alike. If you think that this article was of value to you, feel free to share it with others.